Shop overview
ShopeeLazadaTikTok
Track your profit, costs, margin distribution, and top/bottom product performers in one dashboard.
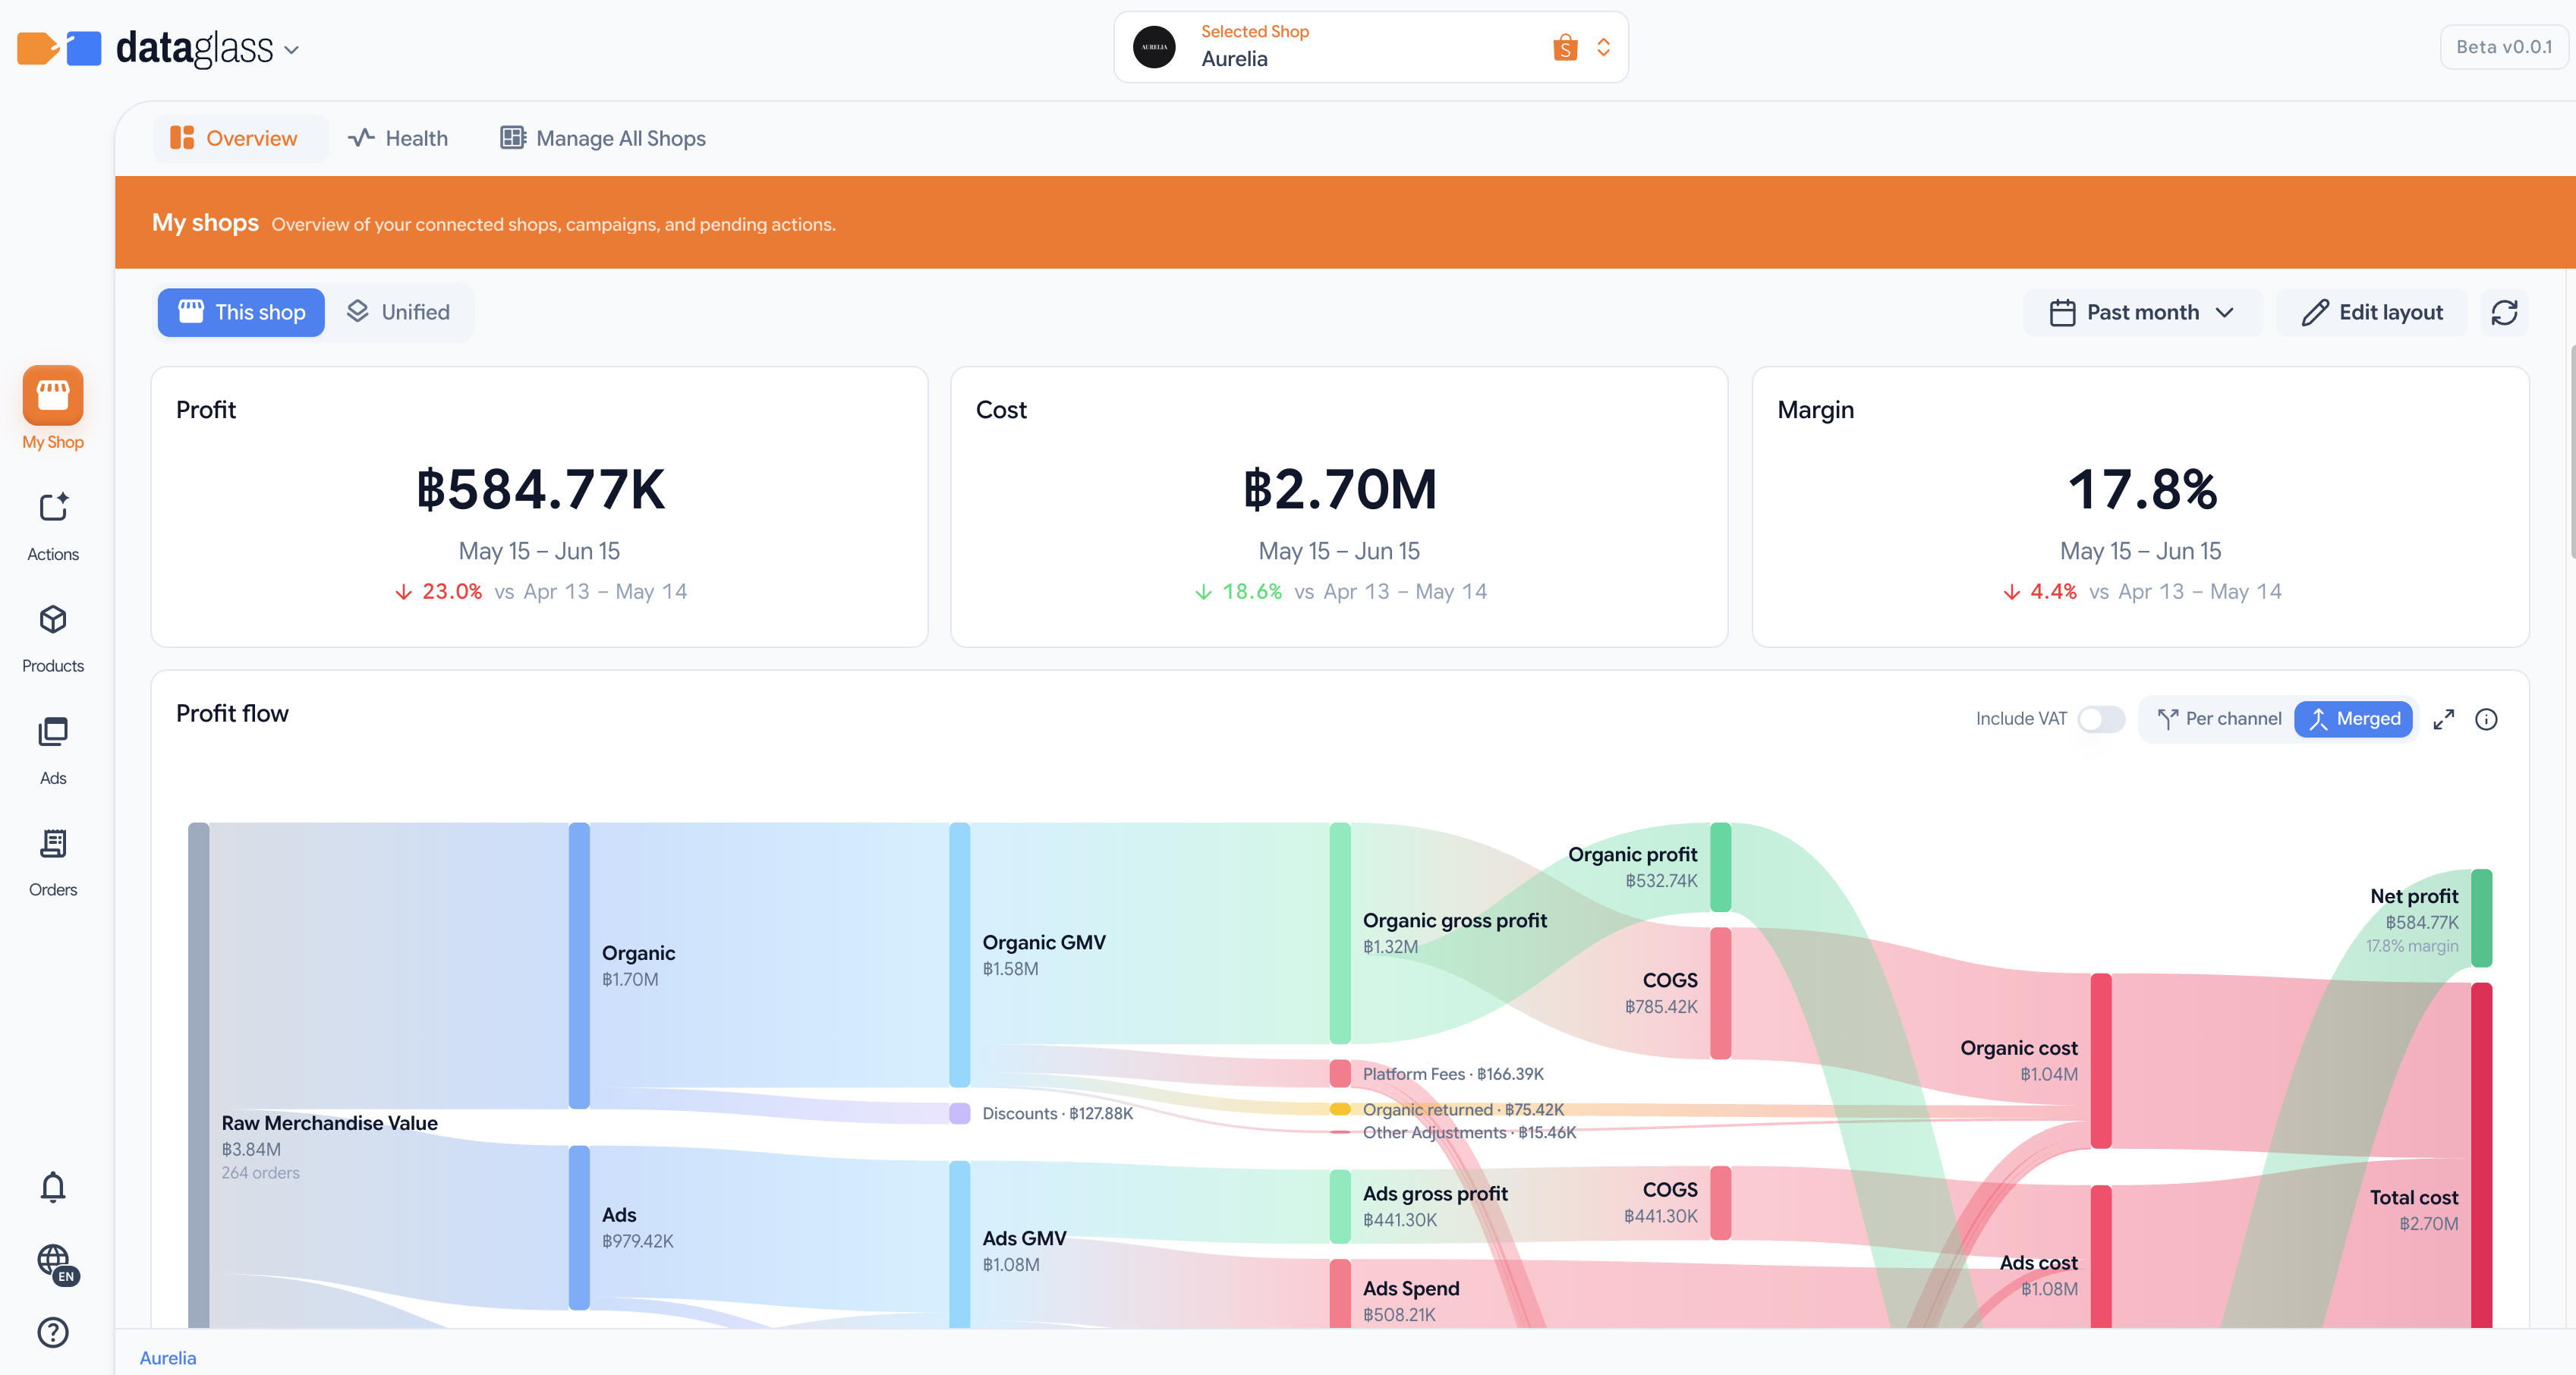
Shop overview is your profit dashboard. It displays headline KPIs (profit, cost, margin), a profit-flow breakdown, product-health distribution, and your top and bottom performers — all for the selected date range.
What you see
- Profit, Cost, Margin KPIs — totals and daily average for the selected period.
- Profit-flow Sankey — where your revenue goes: platform fees, COGS, shipping, and net profit.
- Profit and margin distribution — a breakdown by product category or shop.
- Product health whisker plot — distribution of review ratings, compliance, and stock levels across your catalog.
- Top/bottom performers — products with the highest and lowest margins.
How to use it
- Select a date range using the date picker (default: last 30 days).
- For Shopee shops, toggle Include VAT to see profit with or without value-added tax.
- Toggle This shop / Unified view to compare a single platform vs. all shops consolidated.
- Click any chart or card to drill into product-level details.
The overview data updates daily. VAT filtering is only available for Shopee this-shop views. Dates are shown in your browser's local timezone.
Go deeper
For curious sellers who want to know what every figure really means and how it's derived (Shopee):
- Understanding the numbers — what each value is, settled vs. estimated, and why the screen sometimes surprises you.
- Attribution & dedup — how a sale is credited to an ad or an affiliate, why the ad sales figure is trustworthy, and how cancelled orders are stripped out.